

Monitoring & resources
The Resources page
Section titled “The Resources page”Open Monitoring (/admin/resources, visible to any superuser) to see a live snapshot of host
utilization:
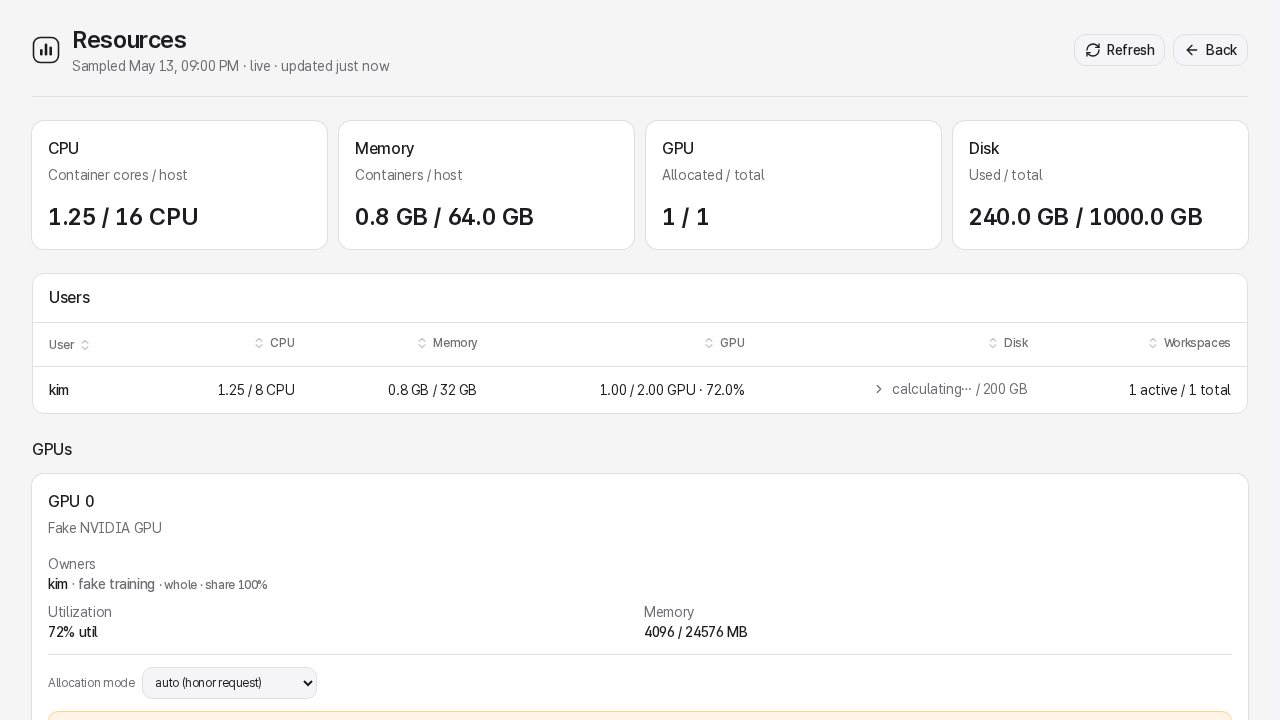
- Per-user breakdown - CPU cores, memory, GPU fraction, and disk used vs. its advisory alert threshold for every user with at least one running workspace.
- GPU cards - current utilization percentage, temperature, and memory used per physical GPU.
- Image storage - per-user image disk consumption.
- Idle candidates - running workspaces that haven’t had recent CPU, GPU, or terminal
activity (based on the
idle_window_secondsthreshold).
The page polls the server every few seconds; click Refresh to force an immediate sample.
Untracked GPU usage
Section titled “Untracked GPU usage”If nvidia-smi sees GPU compute processes that don’t belong to any LabPod workspace, the
Resources page shows a warning under the affected GPU. This usually means:
- A user is running training directly on the host outside any container.
- A workspace was deleted but a child process retained GPU memory.
To investigate:
nvidia-smi --query-compute-apps=pid,process_name,used_memory,gpu_uuid --format=csvTo free:
sudo kill -TERM <pid># If still running after 30 seconds:sudo kill -KILL <pid># Run these as rootkill -TERM <pid># If still running after 30 seconds:kill -KILL <pid>See GPU configuration for how to tune or disable the inspector.
Disk-pressure banner
Section titled “Disk-pressure banner”When the configured disk-capacity filesystem crosses 90% used, the admin dashboard shows a
disk-pressure banner. LABPOD_DISK_ROOT defaults to /home; LabPod also monitors every distinct
filesystem that holds an enabled user’s effective rootless Podman graphroot. Act before image
pulls, writable layers, or workspace data start failing.
Disk hygiene commands:
du -sh /var/lib/labpod/ # database + backupsdu -sh /var/lib/labpod/backups/ # backup files onlysudo -u <user> podman system df # per-user image storage (run once per user)# Run these as rootdu -sh /var/lib/labpod/ # database + backupsdu -sh /var/lib/labpod/backups/ # backup files onlyrunuser -u <user> -- podman system df # per-user image storage (run once per user)LabPod has no root workspace-image store. Monitoring is read-only for administrators: root and other superusers can see per-user image usage and operation history, but cannot delete or prune another user’s images.
Largest disk consumers in a typical deployment:
- Container images in each user’s effective rootless Podman graphroot
- Hugging Face model caches in
<passwd-home>/work/.hf-cache/, or the relocated<LABPOD_WORK_BASE>/<user>/work/.hf-cache/(LabPod setsHF_HOME=/work/.hf-cache) - Datasets in shared mount directories
To put every user’s rootless store on another local disk, or safely move existing stores, see Rootless Podman storage. LabPod discovers the effective path but does not edit Podman configuration or move layers.
Usage reports
Section titled “Usage reports”The admin Usage report page (/admin/usage, under People, visible to any superuser) shows
per-user daily summaries and lets you export CSVs:
/api/usage/users/{serverUserID}- one user’s daily stats/api/usage/users/{serverUserID}.csv- CSV download/api/usage/all.csv- all users in one CSV
Reporting periods and CSV day values use UTC. Raw usage samples are retained for at least 25
hours (48 by default); daily rollups are kept indefinitely. The chart provides the most recent 12
months and the year/month selectors and chart bars load a month’s daily detail. Adjust raw
retention via the runtime setting usage_sample_retention_hours.
Audit logs
Section titled “Audit logs”The Audit page (/admin/audit, visible to any superuser) shows a chronological log of every
mutation:
- User creation and deletion
- Workspace starts, stops, and owner-initiated deletions; administrator force-stops
- Workspace-template and policy changes
- Image pulls and builds
- Login failures
Correlate login failures with the auth.login_failed journal entries:
sudo journalctl -u labpod --since "1 hour ago" | grep login_failed# Run these as rootjournalctl -u labpod --since "1 hour ago" | grep login_failedAudit history is retained indefinitely by default. An administrator can set a positive audit-log retention window under System → Advanced overrides when the installation’s retention policy permits permanent removal of older audit records.